The crypto market is serving up a classic rotation play as meme coins steal the spotlight from their blue chip cousins.
Global crypto markets posted gains alongside traditional equities following geopolitical easing, with overall market sentiment shifting from fear to greed. Traditional markets are providing strong tailwinds—the S&P 500 inched higher to a fresh record this week, breaking above the psychologically important 6,000 level for the first time since February. Meanwhile, the geopolitical picture has improved dramatically as oil prices fell sharply Tuesday, returning to levels last seen before the Iran-Israel conflict, with Brent crude dropping 6 to $67.14.
As investors feel calm in the markets, and consider putting money on riskier bets, the cryptocurrency market as a whole grew 2.5 today to $3.33 trillion, with 98 of the top 100 coins in the green for the last 24 hours.
Bitcoin consolidates as institutions keep accumulating
 Bitcoin price data. Image: TradingView
Bitcoin‘s modest 3.59 gain to $109,507 masks the underlying strength in the world‘s largest cryptocurrency, supported by a bounce after two days of correction, testing the resistance of a bearish channel in play since mid-May. The price action reflects healthy consolidation after the recent surge, giving the market time to digest gains.
Technical indicators paint a cautiously optimistic picture. The Relative Strength Index, or RSI, for Bitcoin is at 60, suggesting BTC has momentum but isn‘t overheated. You can think of RSI like a temperature gauge where 70+ means the engine is running too hot and might need to cool down. This moderate reading suggests there‘s enough fuel in the markets for another leg higher.
The 50-day Exponential Moving Average, or EMA, provides crucial support below current prices, acting as a safety net that institutions often use to add positions. This indicator measures the average price of an asset for a given period of time. The 200-day EMA sits further below, creating multiple layers of support that would need to break for any serious correction.
However, the Average Directional Index, or ADX, at 12 indicates weak trend strength, which is to be expected considering this small correction happens in the middle of what is a heavily bullish trend in play since at least before the last halving. ADX measures the strength of a trend, regardless of direction.
 Bitcoin price data. Image: TradingView
Key levels: Immediate support at $104,000 (psychological round number), strong support at $96,000 (200-day EMA). Immediate resistance at $112,000 (recent rejection zone), strong resistance at $115,000 (measured breakout target and new ATH zone).
Ethereum battles technical headwinds despite adoption wins
 Ethereum price data. Image: TradingView
Ethereum‘s 3.16 rise to $2,559 shows the smart-contract blockchain king refusing to go down without a fight, even as technical indicators flash warning signs. The network scored a major adoption win as Robinhood‘s deployment of 213 tokenized stock contracts on Arbitrum, an Ethereum layer-2 network, signals growing enterprise adoption, proving that real-world utility continues expanding despite price struggles.
The technical setup presents challenges that traders need to navigate carefully. The RSI at 54 sits right in the middle of its range—neither overbought nor oversold, indicating a market in equilibrium waiting for a catalyst. This neutral reading often precedes sharp moves once the market picks a direction. The ADX at 11 shows essentially no trend.
The elephant in the room is the bearish EMA configuration: the 50-day EMA currently trades above the 200-day EMA, still in bearish configuration. But the gap between those two price zones is very, very small, showing markets are basically trading sideways, with traders opening and closing positions with little margin.
The Squeeze Momentum Indicator confirms volatility is compressed, suggesting a significant move is imminent. With institutional adoption accelerating, the bias leans bullish, but a strong bullish breakout is needed in order to wake up the markets. During compression phases, it is easy to predict that a major movement will happen—but whether it is bullish or bearish is not always clear.
Key levels: Immediate support at $2,400 (round number psychology), strong support at $2,200 (previous accumulation zone). Immediate resistance at $2,600 (50-day EMA rejection zone), strong resistance at $2,800 (breakout target).
SPX6900 rockets higher on technical breakout
 SPX6900 price data. Image: TradingView
But enough about boring ol‘ Bitcoin and Ethereum: Welcome to the fun meme coin madness of the day.
Underdog meme coin SPX6900 just won‘t quit. The token‘s explosive 12 surge to $1.27 represents a textbook oversold bounce that‘s catching traders by surprise, being the best performing cryptocurrency in the entire top 100 coins by market cap.
The meme coin crashed 10 on July 1 due to aggressive shorting, creating a perfect storm for contrarian buyers. Smart money didn‘t waste time: on-chain data shows a greater number of net inflows to private wallets, suggesting whales accumulated at lower prices.
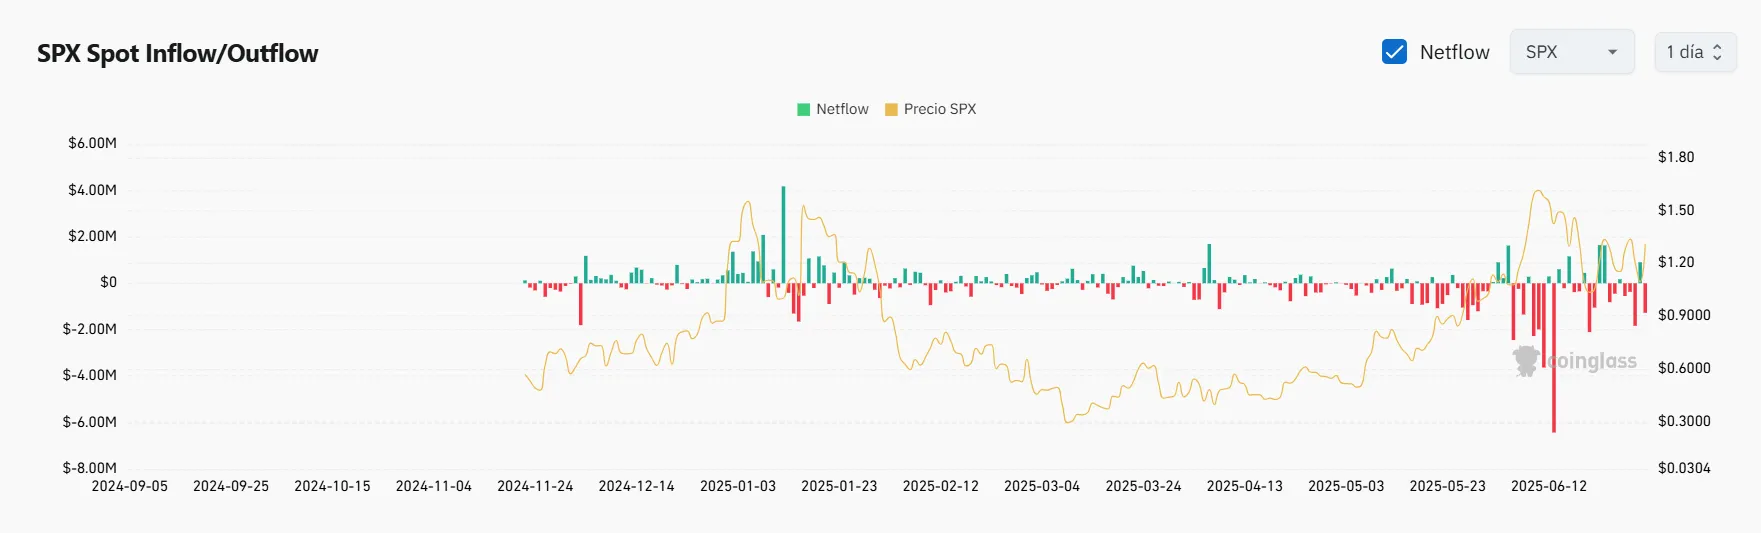 Image: Coinglass
The technical picture is still bullish. The RSI for SPX6900 sits at 52, showing plenty of room to run higher without hitting exhaustion levels that typically trigger profit-taking. The ADX at 23 is approaching the critical 25 level, and is a good sign for traders considering the meme coin is set to break out of a triangle pattern that could be decisive for its longer term future.
The 50-day EMA at $1.10 now acts as a floor. When price stays above the 50-day EMA, it signals short-term bulls are in control. The Squeeze Momentum Indicator shows compression is "on," meaning volatility has tightened like a coiled spring and it could be potentially bullish if all the other indicators remain valid.
Key levels: Immediate support at $1.08-$1.17 (bounce zone), strong support at $0.92 (previous breakdown level). Immediate resistance at $1.40-1.50 (support/resistance wicks during June), strong resistance at $1.70 (June highs).
Your Email